








Spot Bitcoin ETFs Logged $1.918B in Net Inflows During Aug. 17-21 Week
U.S. spot Bitcoin exchange-traded funds pulled in roughly $1.918 billion in net inflows over the Aug. 17 to Aug. 21 trading week (ET), extending the demand signal that institutional allocators track through the ETF wrapper as the primary on-ramp into regulated Bitcoin exposure.

The weekly figure covers the five-session window from Monday, Aug. 17 through Friday, Aug. 21, measured in U.S. Eastern Time, and reflects the net of creations against redemptions across the U.S.-listed spot Bitcoin ETF segment, per SoSoValue’s spot BTC ETF dashboard. The number is a net total, not gross subscriptions, meaning outflows from any individual fund are already deducted. For related coverage, see Spot Bitcoin ETFs See $517M Net Inflows, Biggest in 3.5 Months.
What is confirmed is the aggregate net inflow and the reporting window; what is not independently detailed in the source data available here is the day-by-day or issuer-level breakdown behind the total, which should be read directly from the flow dashboard’s own labeling and update cadence rather than inferred. For related coverage, see Spot Bitcoin ETFs Record $2.1B in Net Outflows Over 30 Days.
How the Weekly Net Flow Figure Is Compiled
Weekly ETF flow totals are built by summing each trading day’s net creations and redemptions across every U.S. spot Bitcoin fund, a methodology that flow trackers such as Farside Investors’ daily BTC ETF table publish on a rolling basis. Because the figure nets inflows against outflows, a single strong week can mask divergence between funds gaining assets and those bleeding them. For related coverage, see Bitcoin ETFs Add $79.15M as Ethereum ETFs Lose $28.04M.
The Aug. 17 to Aug. 21 window is stated in Eastern Time because the underlying funds trade on U.S. exchanges, where the settlement day and the flow attribution follow the New York market clock rather than UTC. Readers comparing this total against other trackers should confirm each uses the same five-session boundary before treating figures as equivalent. For related coverage, see U.S. Spot SOL ETFs See $707,100 in Daily Net Outflows.
Why ETF Inflows Anchor the Institutional Demand Read
Net creations in spot Bitcoin ETFs are commonly interpreted as a proxy for fresh institutional and advised-money demand, since authorized participants create new shares only when end buyers are absorbing them. That framing is why weekly flow prints draw scrutiny even in the absence of a matching move in spot price. For related coverage, see Bitcoin Spot ETFs Add $853M as BlackRock IBIT Leads.
Flow data and price performance are distinct: a positive net inflow week documents capital entering the wrapper, not a guaranteed spot-price outcome, and the two can diverge over any given window. The $1.918 billion print therefore describes demand through the ETF channel specifically, a narrower claim than a broad market-direction call.
The current week fits a pattern of oscillating flows that has defined the segment for months, from stretches when spot Bitcoin ETFs logged their largest single-day inflows in three and a half months to periods when the same funds shed roughly $2.1 billion across a 30-day stretch. Day-level swings, such as sessions where Bitcoin funds added while Ether ETFs bled, underline how quickly the net picture can rotate.
FAQ on Last Week’s Spot Bitcoin ETF Inflows
What does a net inflow mean here? It is the sum of new share creations minus redemptions across the funds over the week, so the total already accounts for money leaving individual products, consistent with how Bitcoin ETF flow reporting is framed in financial coverage.
Why is the timeframe Aug. 17 to Aug. 21 (ET)? Those are the five U.S. trading sessions of the week, measured in Eastern Time because the funds settle on the New York market calendar.
Does the figure cover spot Bitcoin ETFs as a group? Yes, the total is the segment-wide aggregate rather than any one issuer’s flow, and single-fund details, such as weeks when BlackRock’s IBIT led inflows, require the fund-level table to confirm.
Do strong inflows mean Bitcoin’s price will rise? No. Inflows document capital entering the ETF wrapper; they are not a forecast, and flow and price can move independently over any given week.
The next concrete trigger to watch is the following week’s flow print on the same dashboards, which will show whether the $1.918 billion pace held, reversed, or accelerated into month-end.
Disclaimer: This article is for informational purposes only and does not constitute financial or investment advice. Cryptocurrency and digital asset markets carry significant risk. Always do your own research before making decisions.
No tags available.


Other Posts








- China, US Conclude Trade Talks with Focus on Cooperation
- Court Upholds Fed’s Rejection of Custodia Bank’s Request
- Former CFO Convicted for $35M Fraudulent Crypto Investment
- Crypto Weekly: NYSE Backs OKX, Kraken Gets Fed Access, BTC Sells
- DeriW Launches Edge Hour Trading Competition Platform for Derivatives Traders
- Michael Saylor Denies Bitcoin Sell-Off Amid Large BTC Transfer
- Buy Dogecoin on eToro: Step-by-Step Guide for Beginners (2024)
- Kazakhstan Explores Crypto Reserves Backed by National Funds
- JPMorgan Increases Holdings in BlackRock’s Bitcoin ETF
- Nordea Bank Introduces Bitcoin ETP Trading for Nordic Customers
- XRP Spot ETF Launches on Nasdaq Amid Market Fluctuations
- Peter Schiff Challenges Michael Saylor on MSTR’s Business Model
- Thailand Orders Worldcoin to Delete 1.2 Million Biometric Records
- UK Proposes New DeFi Tax Framework to Ease User Burden
- WLFI Under Fire: Analyst Warns Hyperliquid Could Be Next
- Ancient Ethereum Whale Moves $1.19 Billion After Decade
- BlackRock Receives Large Crypto Transfers from Coinbase
- SEC Scrutiny on ALT5 Sigma’s Leadership Disclosure Timing
- Yala Injects $5.5 Million Amid Recovery Efforts
- Radiant Capital Faces $50M Loss in Major Security Breach
- China, US Conclude Trade Talks with Focus on Cooperation
- Court Upholds Fed’s Rejection of Custodia Bank’s Request
- Former CFO Convicted for $35M Fraudulent Crypto Investment
- Crypto Weekly: NYSE Backs OKX, Kraken Gets Fed Access, BTC Sells
- DeriW Launches Edge Hour Trading Competition Platform for Derivatives Traders
- Michael Saylor Denies Bitcoin Sell-Off Amid Large BTC Transfer
- Buy Dogecoin on eToro: Step-by-Step Guide for Beginners (2024)
- Kazakhstan Explores Crypto Reserves Backed by National Funds
- JPMorgan Increases Holdings in BlackRock’s Bitcoin ETF
- Nordea Bank Introduces Bitcoin ETP Trading for Nordic Customers
- XRP Spot ETF Launches on Nasdaq Amid Market Fluctuations
- Peter Schiff Challenges Michael Saylor on MSTR’s Business Model
- Thailand Orders Worldcoin to Delete 1.2 Million Biometric Records
- UK Proposes New DeFi Tax Framework to Ease User Burden
- WLFI Under Fire: Analyst Warns Hyperliquid Could Be Next
- Ancient Ethereum Whale Moves $1.19 Billion After Decade
- BlackRock Receives Large Crypto Transfers from Coinbase
- SEC Scrutiny on ALT5 Sigma’s Leadership Disclosure Timing
- Yala Injects $5.5 Million Amid Recovery Efforts
- Radiant Capital Faces $50M Loss in Major Security Breach
- China, US Conclude Trade Talks with Focus on Cooperation
- Court Upholds Fed’s Rejection of Custodia Bank’s Request
- Former CFO Convicted for $35M Fraudulent Crypto Investment
- Crypto Weekly: NYSE Backs OKX, Kraken Gets Fed Access, BTC Sells
- DeriW Launches Edge Hour Trading Competition Platform for Derivatives Traders
- Michael Saylor Denies Bitcoin Sell-Off Amid Large BTC Transfer
- Buy Dogecoin on eToro: Step-by-Step Guide for Beginners (2024)
- Kazakhstan Explores Crypto Reserves Backed by National Funds
- JPMorgan Increases Holdings in BlackRock’s Bitcoin ETF
- Nordea Bank Introduces Bitcoin ETP Trading for Nordic Customers
- XRP Spot ETF Launches on Nasdaq Amid Market Fluctuations
- Peter Schiff Challenges Michael Saylor on MSTR’s Business Model
- Thailand Orders Worldcoin to Delete 1.2 Million Biometric Records
- UK Proposes New DeFi Tax Framework to Ease User Burden
- WLFI Under Fire: Analyst Warns Hyperliquid Could Be Next
- Ancient Ethereum Whale Moves $1.19 Billion After Decade
- BlackRock Receives Large Crypto Transfers from Coinbase
- SEC Scrutiny on ALT5 Sigma’s Leadership Disclosure Timing
- Yala Injects $5.5 Million Amid Recovery Efforts
- Radiant Capital Faces $50M Loss in Major Security Breach



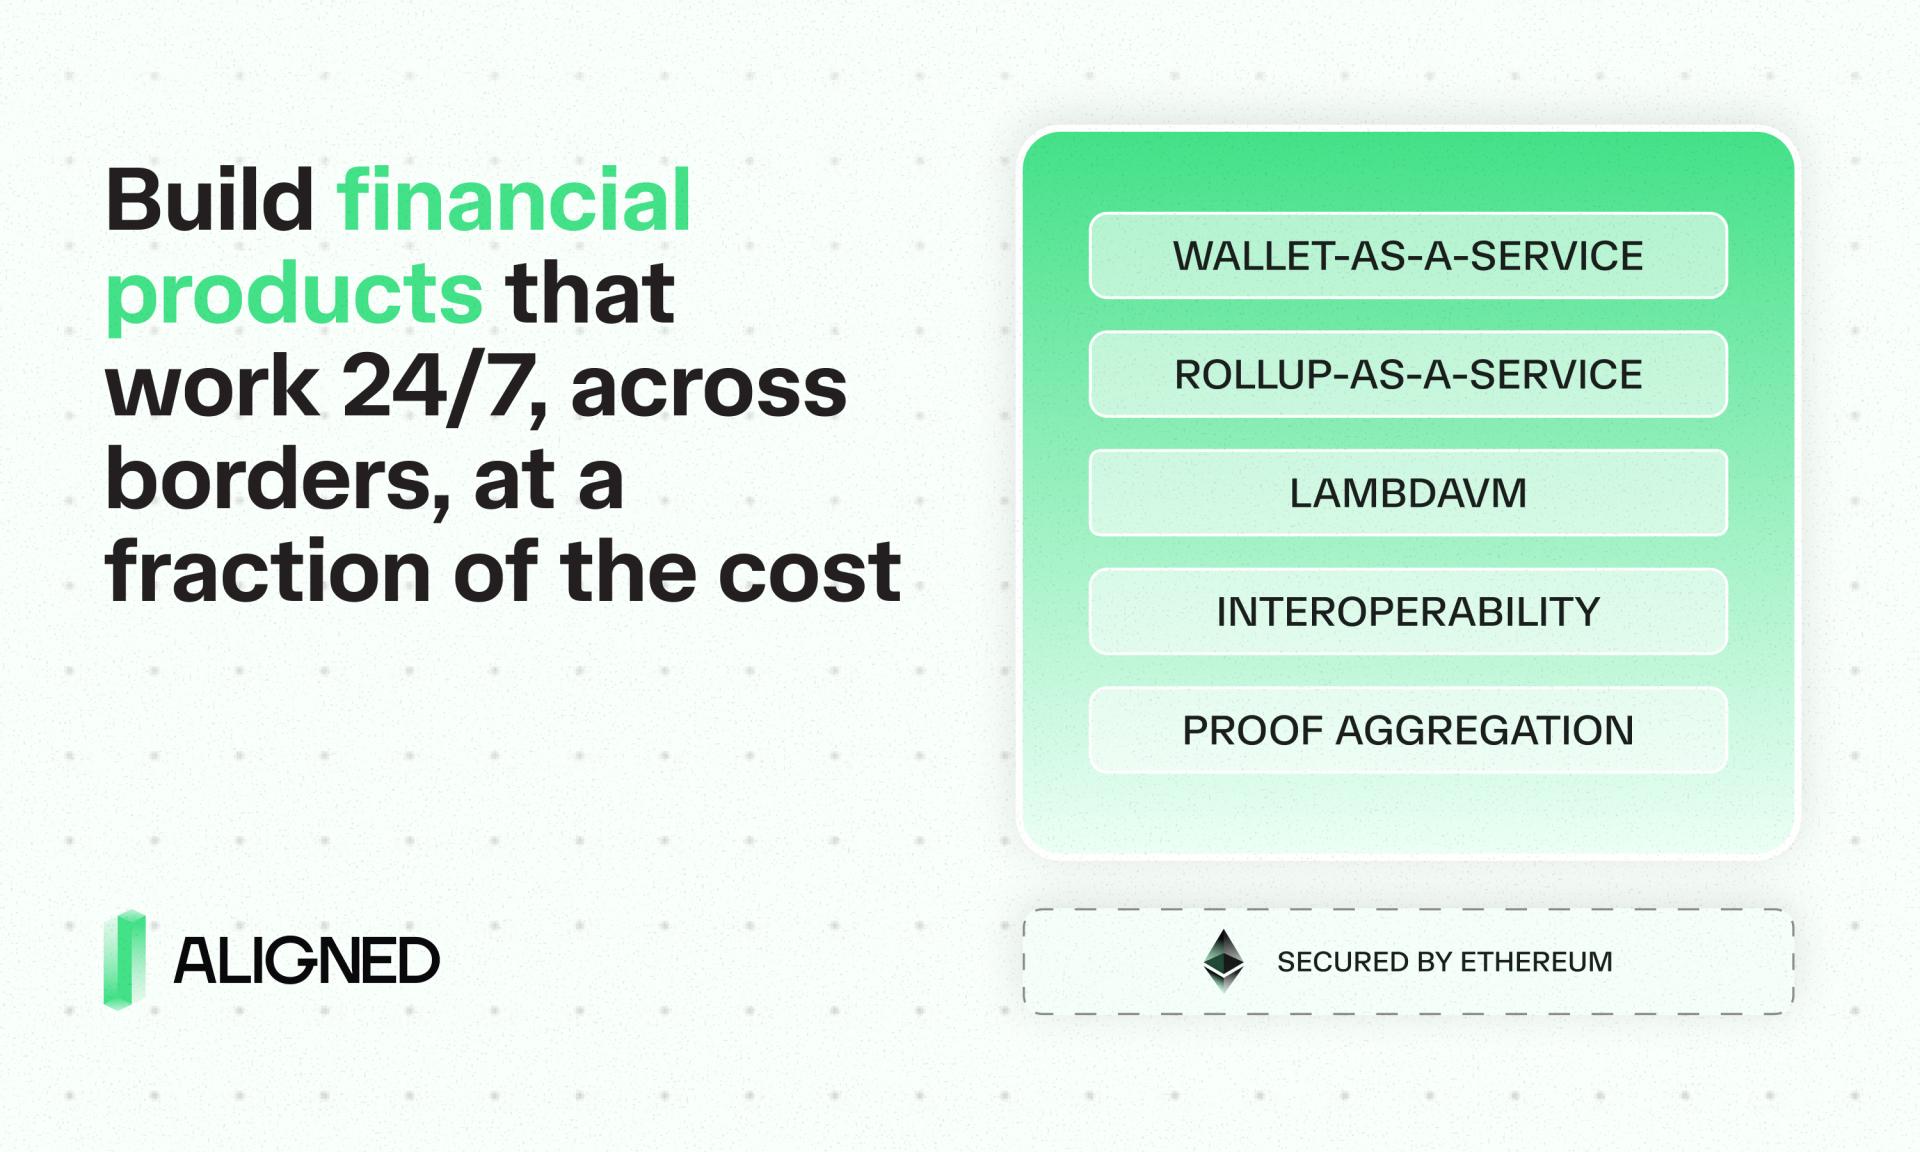
Aligned Launches $ALIGN, the Native Token of Its Full Ethereum Stack
Eightco Holdings Reports $389M in Holdings, Including OpenAI, Beast Industries, 16,000+ ETH and 302M WLD